Buildings for Sale in Toronto

Category: Operations

84% of Ontario LTB tenancy cases this year were filed by landlords, not tenants. Before drawing a conclusion from that number, it’s worth understanding the structure behind it.

Arrears and hold-over applications are procedurally landlord-initiated by design — a tenant doesn’t file to evict themselves. So the number partly reflects how the system is built, not necessarily who’s “in the right” more often.

It’s also fair to ask whether tenants are underusing the remedies available to them — repair orders, harassment complaints, illegal fee disputes. Both readings deserve airtime.

#OntarioRealEstate #LTB #TenantRights #LandlordTenantLaw #RentalMarket

one in six LTB order is ex parte

Ontario’s LTB issued 40,844 orders between January and May 2026 — and 6,523 of them, almost 1 in 6, were ex parte. Decided without either side in the room.

That’s not automatically a red flag. Sometimes it’s a no-show, sometimes an unopposed filing. But it’s worth knowing how often the system rules without a hearing.

Worth watching for anyone navigating the LTB from either side of the table, Smarties.

#OntarioRealEstate #LandlordTenantBoard #LTB #PropertyManagement #OntarioLaw

What Actually Traded: Ontario Multifamily, June 2026

Ontario Multifamily Market Report — June 2026 | Buildings for Sale Toronto
Monthly Market Intelligence · June 2026

What Actually Traded: Ontario Multifamily, June 2026

Not a forecast. Not a survey. Every registered multifamily sale in Ontario last month — 64 buildings — and what they tell you if you’re buying or selling.

The headline
$322.4M
registered across 64 multifamily sales province-wide
The reality
$1,900,000
the typical building that actually changed hands

The gap between those two numbers is the whole story this month.

01 — OverviewThe month at a glance

June 2026 saw 64 multifamily transactions close across Ontario, totalling $322,449,628 in registered consideration. But the headline hides the real story.

Roughly 39% of that volume — $126,107,192 — sits in just 3 deals at $20M and up — largely seniors- and care-housing acquisitions by major operators, plus a partial-interest recapitalization of a trophy rental — not conventional apartment sales. Strip those out and what’s left is the market most buyers and sellers actually operate in: the typical arm’s-length trade cleared around $1,900,000, and 25 of 64 deals landed in the $1M–$2M band — the small apartment, walk-up and plex segment. Activity was genuinely province-wide, led by Metro Toronto on both volume and deal count.

Headline numberValue
Total transactions64
Total registered consideration$322,449,628
Median deal (all sales)$1,975,000
Typical arm’s-length trade$1,900,000
Deals in the $1M–$2M core band25
Deals at $20M+3

02 — SegmentsWhere the deals are

The market splits into a high-volume private tier and a thin, heavy institutional top end. The $1M–$2M band is the engine on count; the $20M+ band is a handful of deals carrying most of the money.

Deal-size bandDealsVolume% of $
Under $1M7$2.0M0.6%
$1M-$2M25$36.1M11.2%
$2M-$5M19$56.1M17.4%
$5M-$20M10$102.2M31.7%
$20M+3$126.1M39.1%

03 — GeographyRegional breakdown

Volume leaders can be deceiving — a single large or distressed deal lifts a region’s total well above where its typical trade sits. Read the median column for the real local picture.

Region / CountyDealsVolumeMedian
Metro Toronto17$105.8M$2,250,000
Halton Region3$46.0M$2,400,000
Russell Township2$43.0M$21,523,750
Wellington2$22.9M$11,425,000
Ottawa-Carleton7$18.4M$2,500,000
Niagara S2$11.0M$5,500,000
Hastings County2$7.1M$3,562,500
Hamilton-Wentworth5$5.5M$1,250,000
Kitchener-Waterloo4$5.5M$1,455,000
Frontenac County3$5.3M$1,310,000
Middlesex County2$2.4M$1,200,000
Durham Region2$2.0M$1,015,000
Lambton2$1.3M$650,000

04 — YieldsCap rates & price-per-door: market context

Registered sales don’t disclose rent rolls or unit counts, so a cap rate or per-door figure can’t be calculated from the transactions themselves. For a frame of reference, here’s where the broader market sits:

Market benchmarks (third-party)

Cap rates: CBRE’s most recent Cap Rate Survey (Q1 2026, published April 2026) reports Canadian multifamily yields continued to inch higher quarter-over-quarter — meaning values are softening, not firming. The GTA institutional benchmark has moved into roughly the 4.5%-4.75% range and up (CBRE, reported via RENX, 2025). A current risk worth heeding: Colliers’ 2026 commentary flags rent declines in Ontario pressuring multifamily underwriting and investment.

Price per door: The most recent published per-door benchmarks (CBRE via RENX, September 2025) put well-maintained, institutionally owned apartments in the mid-to-high $300,000s per unit, and privately held buildings with below-market rents closer to $250,000-$275,000 per unit. Nothing fresher has been published since — treat these as late-2025 reference points, not live June pricing.

Caveat: Published surveys cover institutional-grade, larger assets; the smaller private buildings that make up most of this month’s deals often trade at materially different yields. And note June’s top end skews to seniors and care housing, which is priced on operating income, not apartment rents — don’t read it as conventional-apartment strength.

These are third-party market benchmarks, not derived from the sales above. The cap rate and per-door on any specific building depend on its actual income and expenses — which is what our underwriting and advisory work is for.

05 — CapitalHow buyers are financing

The registered charges behind these sales reveal how multifamily is actually getting funded in a high-rate market — and the spread between the haves and have-nots is stark.

SENIORS & CARE HOUSING DROVE THE TOP END

The two largest registered deals this month were not apartment buildings in the ordinary sense — they were seniors / retirement-housing assets acquired by major, publicly traded operators (~$43M and ~$41M). A long-term-care home and additional retirement lodges also traded. That matters: seniors and care housing is priced on operating income and care revenue, not apartment rents, so a large share of June’s headline volume reflects the seniors-housing capital cycle rather than the conventional rental market. Strip it out and the apartment top end was noticeably quieter than the total suggests.

A TROPHY RENTAL RECAP, NOT A BUILDING SALE

The month’s third-largest figure (~$42M) was a 50%-interest transfer in a trophy downtown Toronto rental — a joint-venture recapitalization in which one institutional partner bought into a half-stake, not an open-market sale of a whole building. Real capital moved, but the number is a half-interest and shouldn’t be read as a full-asset comparable.

THE FINANCING SPLIT: INSURED SUB-4% VS. BRIDGE & PRIVATE

On the healthier, stabilized apartment deals, buyers secured 5-year insured-style money in the mid-3% to high-3% range — the low-cost lane is open for product that qualifies. At the margins, several deals leaned on short-dated bridge and private / MIC capital, including bridge charges priced high and maturing within months. One important honesty note when reading registry data: many eye-catching face rates (Prime-plus-large-margin ‘on demand’ charges, and 24% figures) are demand or collateral / security registrations, not the borrower’s true cost of funds — the genuine acquisition money this month clustered in the mid-3%s on insured deals and high-single-digits on private ones.

AFFORDABLE & MISSION-DRIVEN BUYERS STILL PRESENT

  • A community land trust acquired an asset partly on a 0%-interest charge — the affordable / mission-driven thread that also showed up in May.
  • A level of government was among the month’s buyers, acquiring an institutional residential property in the north.

06 — DistressCourt & lender-driven activity

By situation type. Related-party and partial-interest transfers are restructures, not market comps — read them accordingly.

SituationCountWhat it tells you
Related Parties3Restructures / family transfers. Excluded from Notable Transactions — not market comps.
50% Interest1A partial-interest / JV recapitalization of a trophy rental — half the asset, not a full sale.
Zero Cash1No cash consideration recorded — a debt-assumption or related transfer.
Power of Sale1One lender-driven sale — the only classic distress signature this month.

07 — NotableThe month’s biggest trades

Largest registered sales by total consideration, excluding related-party transfers. Specific addresses and parties are held in our records — see the note below.

#MarketApprox.Situation
1Halton Region~$43MArm’s-length
2Metro Toronto~$42M50% Interest
3Russell Township~$41MArm’s-length
4Metro Toronto~$18MArm’s-length
5Wellington~$17MArm’s-length
6Thunder Bay~$13MArm’s-length
7Algoma~$11MArm’s-length
8Niagara S~$10MArm’s-length
9Metro Toronto~$10MArm’s-length
10Wellington~$6MArm’s-length
11Metro Toronto~$6MArm’s-length
12Nipissing District~$6MArm’s-length

Three to remember

  • Mind the asset mix. The two biggest ‘multifamily’ trades (~$43M and ~$41M) were seniors / retirement-housing acquisitions by major operators. June’s top-end strength is a seniors-housing story, not an apartment one.
  • The ~$42M downtown deal was a half-interest. A JV recapitalization of a trophy rental — only a 50% stake changed hands, so it isn’t a full-building comparable.
  • The private mid-market held steady. The typical arm’s-length trade still cleared around $1.9M across the province. While the headline swung on a few large, specialized deals, the small-apartment and plex market kept trading.

08 — So whatWhat this means if you’re buying or selling

  • Read the mix, not the total. June’s big numbers lean on seniors housing and a JV recap. Conventional apartment activity was steady-but-mid-market — don’t mistake the headline for broad apartment strength.
  • No distress at the top this month. The receivership cluster that defined May did not repeat in this data — the forced-sale opportunity set narrowed, at least for now.
  • The insured lane is open. Stabilized apartment deals secured 5-year money in the mid-to-high 3% range. For well-run product, that financing edge is real.
  • Know your charge before you underwrite. Registry face rates can mislead — a ‘Prime-plus-10%, on demand’ or ‘24%’ charge is often collateral or security, not your true cost. Underwrite the actual money, not the registration.
  • Watch the rent signal. Third-party research flags softening Ontario rents pressuring multifamily underwriting through 2026. Stress-test your rent assumptions before you buy.

One timing note: these transactions are grouped by closing / registration date, not the date each deal was negotiated. A sale that registered in June 2026 may have gone firm weeks or months earlier — so read this as a record of capital and title actually changing hands, not a real-time read on this month’s sentiment.


Buying or selling a multifamily building?

We work multifamily across Ontario every day — acquisition, disposition, financing and underwriting. If this report is useful, the conversation about your building is more useful.

Want our read on a specific building or submarket — what a comparable trade really means for your value or your offer? That’s deal-level advisory, and it’s what we do. Reach out and we’ll walk through it with you.

Cap-rate and price-per-door figures cited above are third-party market benchmarks (CBRE Canadian Cap Rates & Investment Insights, Q1 2026 (April 2026); CBRE reported via RENX, September 2025; Colliers Canada Cap Rate commentary, 2026). They are general market context only, are not derived from the transactions analysed here, and should not be applied to any individual property. Transaction data reflects registered sales available as of publication and may be revised as records update.

Addy Saeed is a Licensed Real Estate Broker with RE/MAX Gold Realty Inc. (RECO Licence 4735346) and Founder & General Manager of Westcliff Living. The author may reference entities in which he holds financial interests, including Westcliff Asset Management and Westcliff Living. This report is for informational and educational purposes only and is not financial, legal, mortgage, or investment advice. Always conduct your own due diligence and consult qualified professionals.

Rental Development Opportunities in the GTA: Q1 2025 Trends & Strategic Insights

Toronto’s rental market is evolving rapidly in 2025, shaped by shifting policies, economic pressures, and investor ingenuity. Whether you’re a seasoned developer or a first-time investor, this report unpacks the most critical trends, risks, and opportunities for rental developments in the GTA—with actionable strategies to maximize returns.


GTA Rental Market Snapshot

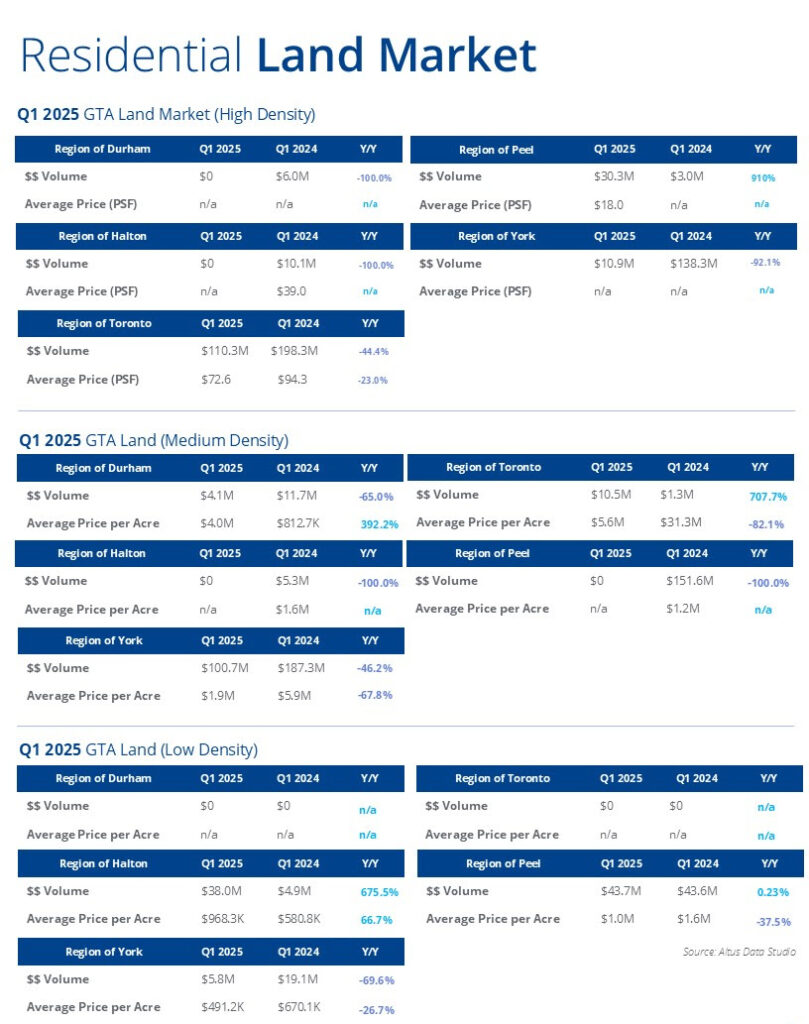
Q1 2025 GTA Land Transaction Trends

The first quarter of 2025 revealed stark contrasts in Toronto’s rental development landscape:

  • High-Density Struggles: Regions like Durham and Halton saw $0 in high-density transactions (▼100% YoY), while Toronto managed $110.3M—still a 44% drop from 2024. Rising bond yields and pre-construction defaults (5-10%) chilled investor confidence.
  • Medium-Density Momentum: Peel ($43.7M) and Halton ($38M, ▲675% YoY) emerged as safe havens, driven by demand for townhouses and duplexes.

Key Takeaway: Mid-sized projects are outperforming skyscrapers.


3 Drivers Fueling Rental Demand

Falling construction costs boost rental feasibility.
  1. Cheaper Builds, Faster ROI
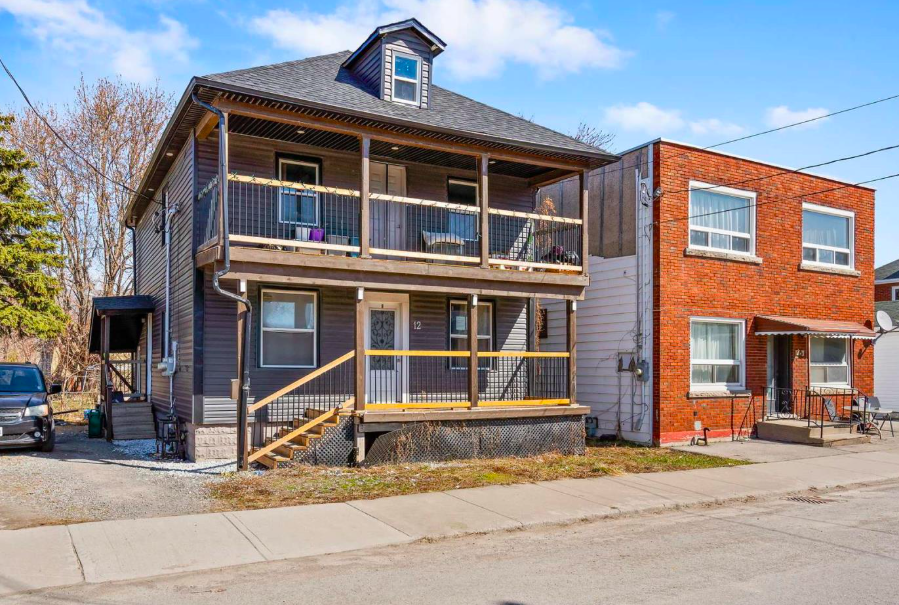
    High-density construction costs fell 10-15%, while low-rise builds dropped 20-30%. Example: 12 Nickel Street (Port Colborne) slashed renovation costs to secure an 8% cap rate.
  2. Policy Wins for Developers
  • Midrise As-of-Right Zoning: Skip rezoning for 6-8 story rentals on transit corridors (e.g., Scarborough’s Kingston Road).
  • Affordable Housing Incentives: Defer development charges for projects with 5-10% affordable units.
  1. Transit-Oriented Tenants
    Properties near subway/LRT stations (e.g., 2555 Dundas West) command higher rents and lower vacancies.

Top 3 Rental Investment Opportunities

1. Multi-Family Near Transit Hubs

2555 Dundas Street West exterior
$111k Annual Income: Steps from Bloor-Dundas Station
  • Case Study: This legal duplex + basement unit grosses $111k/year. Tenants prioritize transit access over luxury finishes.
  • Strategy: Target areas like Hurontario LRT stops or North York’s Sheppard-Yonge corridor.

2. Halton’s Mixed-Use Boom

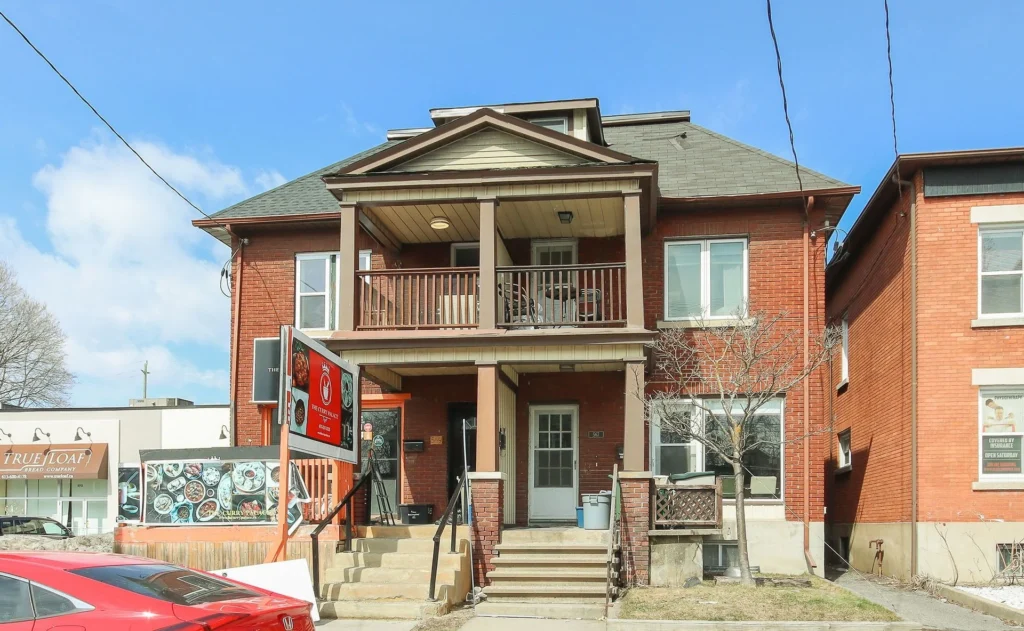
569 Gladstone Avenue (Ottawa) commercial/residential mix
Halton’s Blueprint: Retail + Rentals = Steady Cash Flow


Halton’s 675% YoY surge in medium-density volume signals untapped potential. Convert aging commercial lots into rentals with ground-floor retail (e.g., cafes, clinics).

3. Affordable Housing Partnerships

Toronto’s DC deferral incentives.


Toronto’s pipeline includes 4,000+ units eligible for DC deferrals. Partner with the city to fast-track approvals and tap into rising demand.


Risks & How to Mitigate Them

  • Default Risks: Avoid pre-construction condos in car-dependent suburbs. Fix: Focus on transit hubs like 417 Grey Street (London).
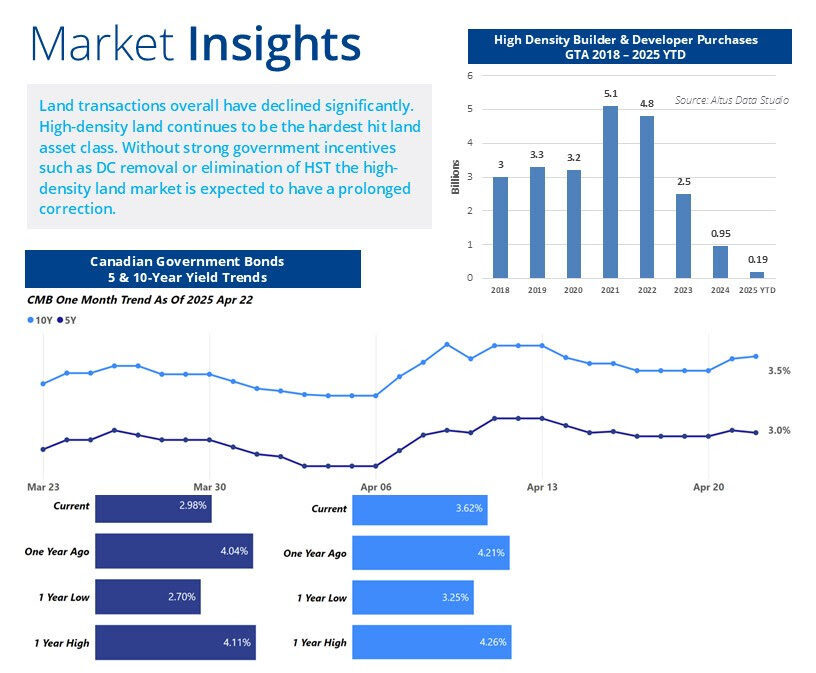
  • Financing Headaches: With 10-year bond yields at 4.21%, lenders are cautious. Fix: Target smaller assets like 50 Binscarth Cres (Ottawa), offering 6.7% ROI with minimal red tape.

Strategic Recommendations

  1. Double Down on Peel & Halton: Duplexes near transit (e.g., Mississauga’s Hurontario LRT) promise stable returns.
  2. Leverage OPA 778: Build midrises in Scarborough or Etobicoke without rezoning delays.
  3. Acquire Undervalued Gems:
  • 110 Walmer Road (Annex): Reset rents post-vacancy for instant cash flow.
  • 241 Ridout Street (London): A turnkey duplex near Wortley Village’s schools and cafes.
8% Cap Rate: This Triplex Prints Cash

Why Partner with HeyAddy?

We specialize in unlocking hidden value. For example:

  • Turned a dated triplex (12 Nickel Street) into an 8% cap rate superstar.
  • Helped investors leverage OPA 778 to fast-track a midrise near Yonge-Sheppard.

Explore Our Top Picks:


For personalized advisory, contact HeyAddy Investments at 1-877-439-2339. Let’s turn insights into income.


Q1 2025 Canada Real Estate: Cap Rate Analysis, Risks, and Strategic Opportunities

Breaking down CBRE’s Q1(First Quarter) Canadian Cap Rates & Investment Insights report for smart investors:

The Big Picture: Canada’s real estate market is showing mixed signals in early 2025. While headlines fret about tariffs and office vacancies, hidden opportunities are emerging for sharp-eyed investors. Let’s cut through the noise.

Key takeaways:
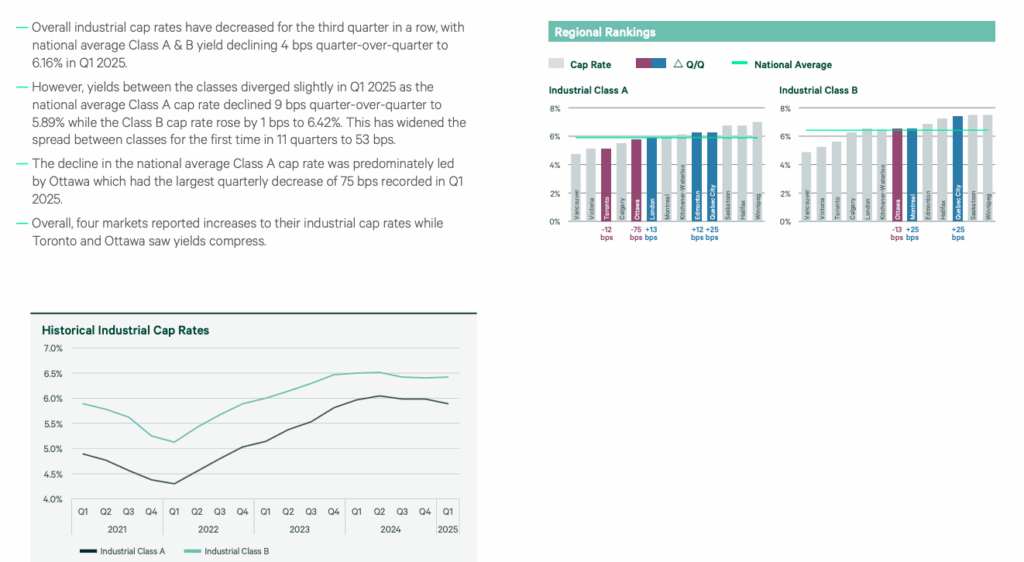
Industrial properties are stealing the show (Ottawa’s cap rates dropped 75 bps!).
⚠️ Suburban offices are bleeding value (Toronto’s Class B hits 9% cap rates).
📈 Multifamily remains steady, but focus on low-rise and secondary cities.

Think of this as your cheat sheet for Q1.


What’s Hot Right Now

1. Industrial Warehouses: The New Gold Rush

Forget condos—2025 is all about logistics. With e-commerce booming and supply chains still recovering, cities like Ottawa (-75 bps), Calgary, and Halifax are seeing record demand.

Why it matters:

  • Ottawa’s Class A industrial cap rates fell to 5.50–6.00%—the sharpest drop nationally.
  • Edmonton’s industrial properties now offer 6.00–6.50% yields, attracting out-of-province buyers.

2. Grocery-Anchored Retail: Boring but Reliable

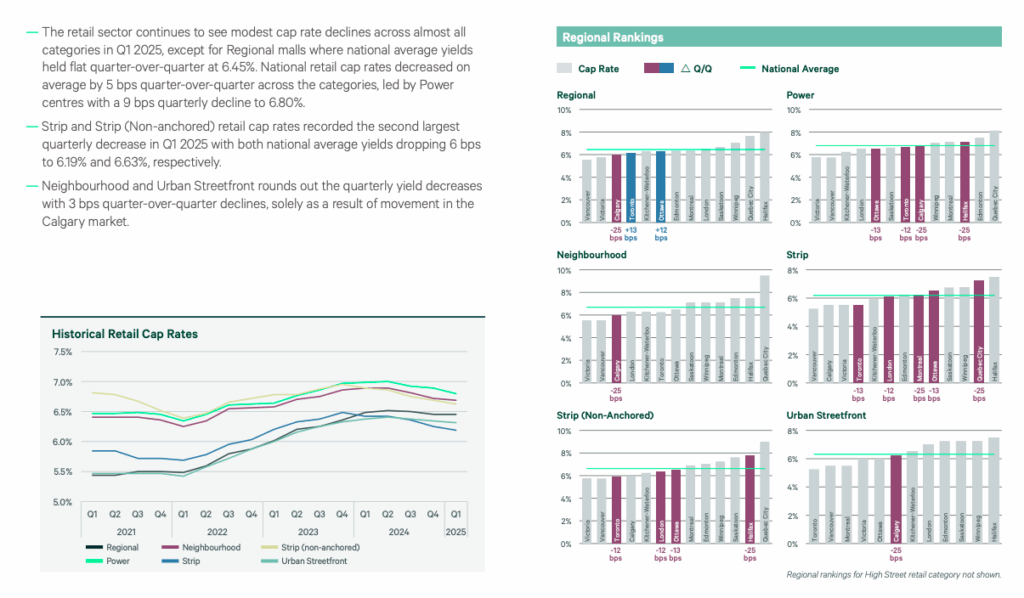
Strips malls with pharmacies or supermarkets are quietly crushing it. Their cap rates fell to 6.19% (vs. 6.63% for non-anchored strips).

Pro tip: Look for properties with lease renewals coming up—rents are rising 5–8% in prime areas.

3. Montreal’s Multifamily Magic

Montreal’s Low-Rise Class B cap rates dropped 37 bps as renters flock to affordable units. With rents up 8% YoY, it’s a cash flow machine.


What’s Cooling Down

1. Suburban Offices: Handle With Care

Toronto’s Suburban Class B cap rates hit 9.00%—a red flag for rising vacancies. Even lenders are avoiding these assets.

The exception: Prime downtown offices (e.g., Toronto Class AA at 5.25–6.00%) still attract global capital.

2. Condo Overload in Toronto

Over 4,000 new units hit the market in Q1. With construction costs up 15% YoY, margins are razor-thin.

3. Regional Malls: Stuck in Neutral

Flat cap rates (6.45%) and shaky tenant demand make these a “wait and see” play.


3 Smart Moves for 2025

  1. Swap condos for industrial: Target Ottawa or Halifax for yields 1–2% higher than Toronto.
  2. Bet on grocery strips: Stable income with less drama.
  3. Ditch suburban offices: Reinvest gains into multifamily (Montreal, Kitchener-Waterloo).

Not sure where to start? feel free to contact us


The Bottom Line

2025 isn’t the year to play it safe—it’s the year to get strategic. Focus on industrial, essential retail, and secondary cities.

For a personalized portfolio review, book a free consult with our team.

From Boom to Bust: Why Toronto Sellers Are Panicking in 2025’s Chilly Market


Introduction: A Family’s Frustration in Toronto

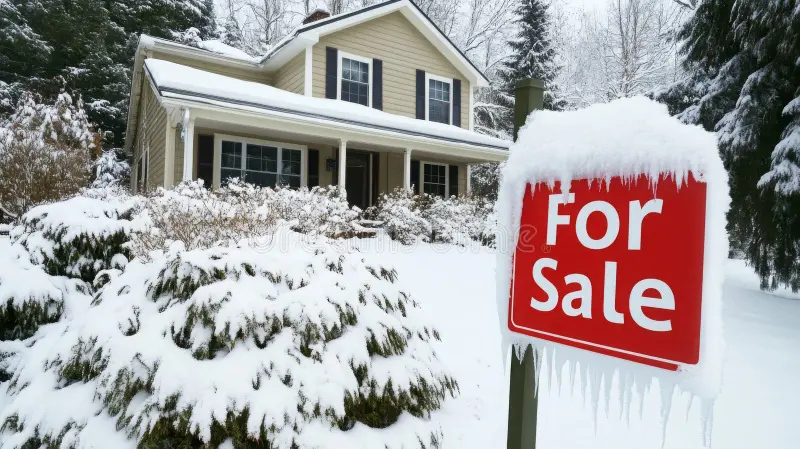
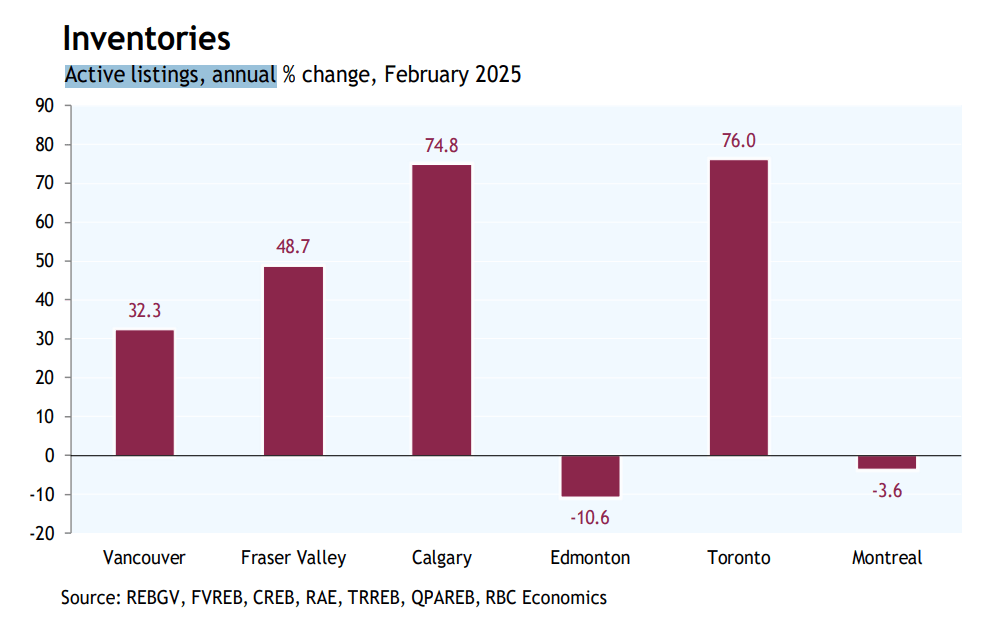
Sarah Thompson had been waiting months to sell her downtown Toronto condo. By January 2025, her realtor was optimistic: “Buyers are finally back!” Then February hit. A blizzard buried the city, and news of a U.S.-Canada trade war splashed across headlines. Her open house? Three visitors. “It’s like the market vanished overnight,” she sighed. Sarah’s story isn’t unique. Across Canada, February 2025 became a month of dashed hopes, shifting power, and snow-covered “For Sale” signs.


The Perfect Storm: Trade Fears Meet Winter Woes


While economists warned of tariffs, Canadians battled a literal storm. Record snowfall in Toronto, Montreal, and Vancouver kept buyers indoors. “Nobody wants to house-hunt in a snowsuit,” joked Vancouver agent Raj Patel. But the chill wasn’t just physical. The U.S. trade war—announced in March—sent shivers through markets early. Buyers paused; sellers panicked.`

By the numbers:

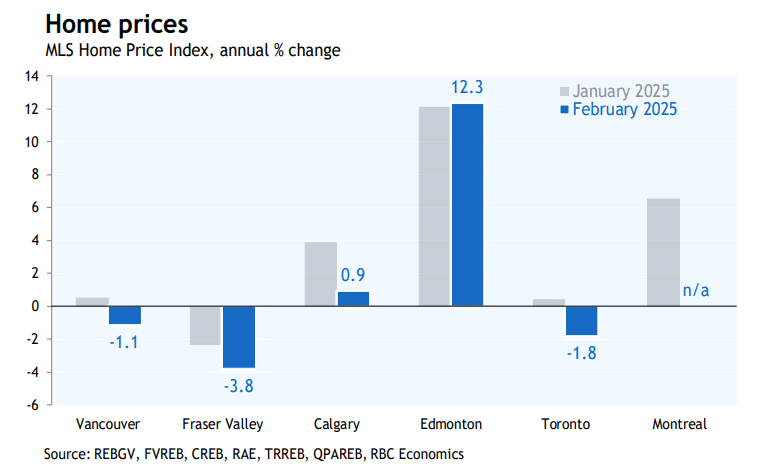
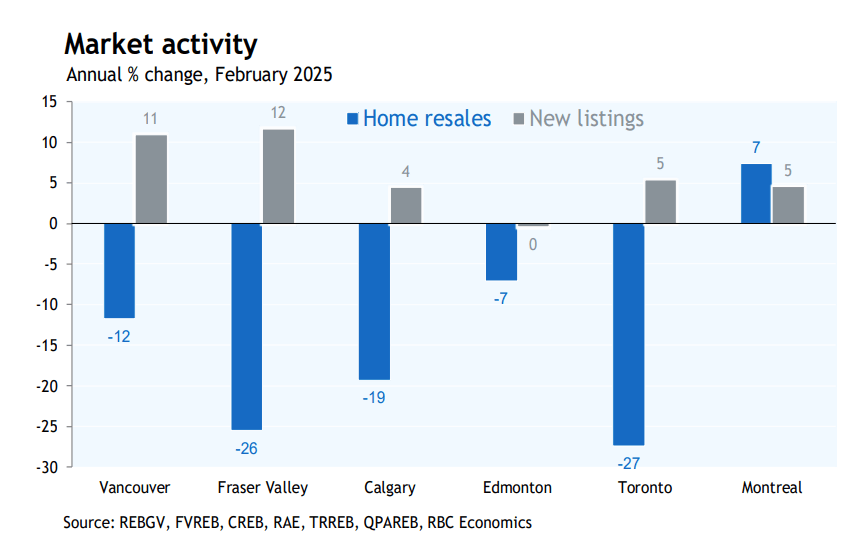
  • Toronto: Sales plunged 29% month-over-month—the steepest drop since COVID’s early days.
  • Vancouver: Condo prices slid 2.8% annually, while detached homes barely clung to 1.8% gains.
  • Calgary: Once red-hot, its market cooled to a 0.9% price growth, down from 11% in 2024.

From Seller’s Dream to Buyer’s Bargain Bin
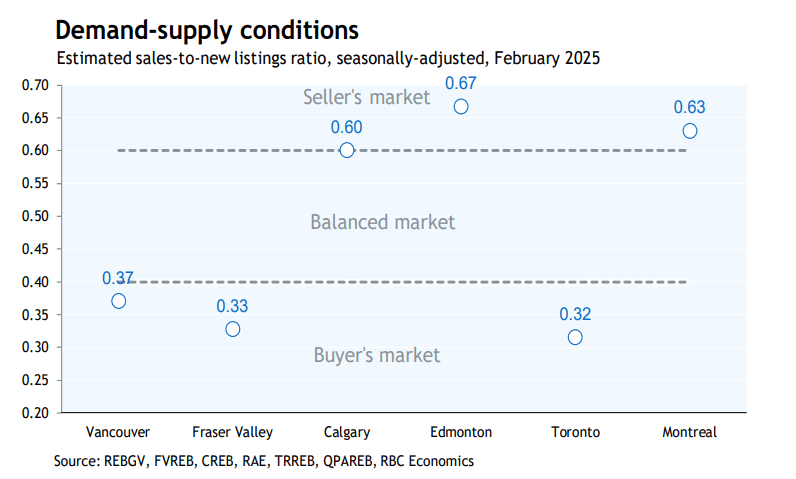
In January, sellers reveled in newfound optimism. By February, the tables turned. “It’s a bloodbath for condos,” said Montreal investor Claire Dubois. Toronto’s condo glut—fueled by investor exits and new completions—left sellers slashing prices. Meanwhile, buyers like Mark Chen in Vancouver finally saw leverage: “I lowballed three places. One seller actually countered!”

Edmonton: The Lone Bright Spot
Not every city faltered. Edmonton’s prices climbed steadily, though even there, agent Liam O’Connor noted: “We’re busy, but everyone’s holding their breath. What if the trade war hits Alberta’s oil jobs next?”


The Human Cost: Dreams on Hold
For first-time buyers, uncertainty reigns. “Do I buy now or wait for prices to drop more?” wondered Calgary teacher Amina Khan. Retirees aren’t spared either. Toronto couple Frank and Grace delayed downsizing: “Our condo’s value dropped $50k in six weeks. We can’t afford to sell.”


What’s Next? A Nervous Spring


March typically kicks off Canada’s busy spring market. This year? Agents are bracing for quiet. “If the trade war drags on, we’ll see more job losses—and more price cuts,” warned RBC economist Robert Hogue.

Yet, silver linings flicker. Renters eye cheaper condos. Bargain hunters scour listings. “This might be my chance,” said Mark Chen, now touring a Vancouver townhouse.


Conclusion: Resilience in the Frost

Canada’s housing market has weathered crashes, pandemics, and now, trade wars. For every Sarah Thompson, there’s a Mark Chen—proof that even in uncertainty, opportunity persists. As snow melts and headlines churn, one truth remains: home isn’t just a market. It’s where lives unfold, blizzards and all.


Written with insights from RBC Economics, local real estate boards, and interviews with homeowners.


2025-2027 Canadian Housing Market Outlook: Where Should Investors Focus?

Let’s cut through the jargon. If you’re eyeing Canadian real estate for your next investment property, 2025 might be your year—but only if you know where to look. The CMHC’s latest report reveals a market in flux, with opportunities hiding in plain sight for savvy investors. Here’s what you need to know, served straight up.


The Big Picture: What’s Shaping Canada’s Market?

  1. Mortgage Rates Are Dropping (Finally!)
    Good news for buyers: Variable-rate mortgages are about to get way more attractive. With the Bank of Canada likely to cut rates further in 2025, borrowing costs are easing. This means pent-up buyer demand—especially for resale homes—will explode. Think first-time millennials, downsizers, and those escaping brutal rental markets.
  2. Condos Are Struggling, Rentals Are King
    Here’s the twist: Condo construction is slowing hard (-15% in Toronto alone for 2025) because investors are spooked. But purpose-built rentals? They’re booming. Governments are throwing cash at developers to build rentals (think tax breaks, faster permits), and tenants are still desperate. Vacancy rates will creep up, but rents won’t crash—landlords just won’t have as much pricing power.
  3. Affordability Is Still a Nightmare (But That’s Your Advantage)
    Let’s be real: Most Canadians can’t afford a detached home. That’s why townhouses and semi-detached units in commuter zones (looking at you, Hamilton and Oshawa) are heating up. Families want space without the $1.5M price tag.
Source: CMHC | Toronto condo starts drop 15% in 2025, while rentals dominate new construction.


Where to Buy: 3 Markets Poised for Growth

1. Toronto’s Suburbs: Skip the Condo, Buy the Rental

Source: CMHC | Toronto condo starts drop 15% in 2025, while rentals dominate new construction.
  • Why It Works:
    Toronto proper is a condo graveyard right now—too many investors stuck with units they can’t sell or rent profitably. But the 905 regions (Mississauga, Vaughan, Pickering) are a goldmine for multi-unit rentals. The feds are fast-tracking approvals here, and rents for a 2-bedroom will hit $2,300+ by 2027.
  • 2025 Rent Forecasts for GTA Suburbs (2-Bedroom Units):
  • Mississauga: $2,100–$2,200/month (up 5% from 2024)
  • Brampton: $1,950–$2,050/month (up 6%)
  • Pickering/Ajax: $1,900–$2,000/month (up 7%)
  • Oshawa: $1,720–$1,800/month (up 8%)
  • Hamilton: $1,650–$1,750/month (up 6%)
    Source: CMHC 2025 Rental Market Outlook
  • Pro Tip: Look for older low-rise apartments near transit. Renovate units between tenants, and you’ll pocket $400–$600/month cash flow even with higher vacancies.

2. Calgary & Edmonton: The New Affordable

  • Why It Works:
    Alberta is stealing Ontario’s millennials. A $600K detached home in Calgary (vs. $1.4M in Toronto) is fueling a buying frenzy. Prices jumped 8% last year—and CMHC says that’s just the start.
  • Pro Tip: Target fixer-uppers in neighborhoods like Forest Lawn (Calgary) or Beverly (Edmonton). These areas are 15 minutes from downtown but still undervalued. Rent to young families or oil/gas workers on 6-month contracts.


3. London & Windsor: The Underdog Play

  • Why It Works:
    These smaller Ontario cities are quietly winning. London’s rental vacancy rate is stuck below 2%, and Windsor’s proximity to Detroit is attracting U.S. remote workers seeking cheap housing. A $250K duplex here can net $2,800/month in rent.
  • Pro Tip: Avoid student-heavy areas (thanks to immigration caps). Focus on neighborhoods like Old East Village (London) with coffee shops and breweries—they’re magnets for 30-something renters.

Red Flags Investors Can’t Ignore

Source: CMHC | Toronto condo starts drop 15% in 2025, while rentals dominate new construction.
  • Student Housing Roulette: Immigration cuts = fewer international students. If you own a rental near colleges (e.g., Brampton, Waterloo), brace for longer vacancies.
  • The “Renewal Cliff”: Investors who bought at peak prices in 2021-2022 face mortgage renewals in 2025-2026. Many will panic-sell. Keep cash ready to scoop up distressed properties.
  • U.S. Trade Wars: If Trump 2.0 slaps tariffs on Canadian goods, manufacturing hubs like Windsor or Oshawa could see job losses. Stick to cities with diversified economies (Calgary’s tech scene, Halifax’s port).

Bottom Line: How to Win in 2025

  1. Ditch Condos, Embrace Rentals: Governments are begging developers to build rentals—join them. Tax incentives are too good to ignore.
  2. Go Small(er): Forget downtown Toronto skyscrapers. A 6-unit walkup in St. Catharines or a duplex in Lethbridge will cash-flow better.
  3. Lock In Rates NOW: Variable rates are dropping, but fixed rates are still a steal compared to 2023. Refinance older properties to free up cash.

Final Thought: The 2025 market isn’t about getting rich quick—it’s about playing the long game. Rental demand isn’t going anywhere, and smart investors will profit by targeting where Canadians can actually afford to live.

Ready to explore off-market deals? Check out Properties For Sale curated list of cash-flow focused properties. No fluff, just results.

2025 Toronto Multi-Family Market Outlook: Strategic Insights for Investors

Canada’s multi-family real estate sector is entering a transformative phase in 2025, marked by stabilizing interest rates, shifting policy landscapes, and sustained demand for rental housing. For Toronto—a city at the epicenter of the nation’s housing challenges—these trends present both opportunities and challenges for investors and stakeholders. Drawing from CBRE’s 2024 Year-End Apartment Report and localized insights, this analysis unpacks what lies ahead for Toronto’s multi-family market.


2024 Recap: A Foundation for Growth

While CBRE’s report highlights British Columbia’s 2024 transaction surge (107 deals totaling $1.65B), Toronto mirrored this resilience. The Greater Toronto Area (GTA) saw a 12% year-over-year increase in multi-family sales volume, driven by private investors and institutional capital pivoting toward stable rental assets. Despite elevated borrowing costs early in the year, Toronto’s market benefited from record immigration, with over 150,000 newcomers settling in the GTA—intensifying demand for purpose-built rentals.

Key Takeaway: Toronto’s chronic undersupply of rental housing kept vacancy rates near 1.7% in 2024, well below the national average of 2.2%.


Interest Rates: A Catalyst for Activity

The Bank of Canada’s rate cuts—from 5% to 3% by January 2025—have reinvigorated investor appetite. Lower financing costs are easing debt service pressures, making acquisitions and refinancing more viable. For Toronto, where multi-family cap rates averaged 3.8–4.2% in 2024, even marginal rate declines could compress yields for well-located assets.

Investor Tip: Suburban markets like Mississauga and Vaughan are attracting attention for higher cap rates (4.5–5.5%) and redevelopment potential.


Rental Market: Balancing Supply and Demand

Toronto’s rental market remains a tale of two realities:

  • Rent Growth: Average two-bedroom rents rose 4.9% in 2024, down from 7% in 2023, reflecting moderating demand and a surge in completions (8,200 new units).
  • Affordability Pressures: Despite moderation, average rents hit $3,200/month for a two-bedroom, pushing tenants toward older, below-market stock.

While 2025 will see another 10,000+ rental units delivered, population growth (3% annually) ensures demand outpaces supply. Investors should monitor neighborhoods like Scarborough and Etobicoke, where rent-to-price ratios remain favorable.


Policy Shifts: Navigating New Rules

Federal and provincial policies are reshaping Toronto’s investment landscape:

  • Rental Protection Fund: Ontario’s $300M initiative mirrors BC’s program, incentivizing non-profits to acquire aging rentals.
  • Airbnb Regulations: Toronto’s strict short-term rental rules have redirected 1,200+ units to the long-term market since 2023.
  • Green Retrofits: New energy efficiency mandates could impact operating costs for pre-2010 buildings.

Proactive investors are targeting value-add opportunities—upgrading older properties to meet sustainability standards while leveraging government grants.


Financing Trends: Adapting to New Realities

CBRE’s 2024 Mortgage Commentary underscores critical shifts:

  • CMHC Flexibility: Expanded loan programs now cover 50-year amortizations for energy-efficient retrofits.
  • Private Lenders: Alternative capital fills gaps for mid-rise projects, particularly in secondary markets like Brampton.
  • Construction Challenges: Rising material costs and labor shortages delayed 15% of GTA projects in 2024.

For developers, pre-leasing requirements (now 60–70% for condo rentals) demand meticulous market analysis.


2025 Forecast: Three Trends to Watch

  1. Cap Rate Stability: Prime downtown Toronto assets may see sub-3.5% cap rates as institutional buyers return.
  2. Suburban Growth: Transit-oriented developments near upcoming Ontario Line stations (e.g., Liberty Village, East Harbour) will dominate new supply.
  3. Affordable Housing Partnerships: Joint ventures with municipalities could unlock underutilized land for mixed-income projects.

Positioning for Success in Toronto’s Market

Toronto’s multi-family sector remains a cornerstone of Canada’s real estate economy. For investors, 2025 offers a window to capitalize on lower rates, strategic partnerships, and undervalued assets. However, success hinges on localized expertise—understanding neighborhood dynamics, policy impacts, and financing nuances.

At buildingsforsaletoronto.com, we combine global insights with hyperlocal knowledge to guide clients through Toronto’s evolving market. Whether you’re acquiring your first rental property or expanding a portfolio, our team ensures tailored strategies aligned with your goals.

Act Now: With rate cuts fueling competition, early movers will secure the best opportunities.

Contact today to explore how Toronto’s multi-family market can fit into your 2025 investment strategy.


Discover Your Property’s Worth with Online Home Value Calculators

Finding the value of your property is an important step in the selling process, especially in today’s digital era, where software and AI generated tools are rampant. In the real estate field, there are powerful tools as well that you can use to help sellers gain insight into their property’s value. It is called Online home value calculators; it offers an easier and accessible way to estimate the value of your property. Following will be a better way to discuss the benefits of Online Home Value Calculators.

Accurate Assessments

These advanced algorithms and real-time data provided by online home value calculators give accurate estimates of the worth of your property. Sellers can get an estimate that reflects what is happening in the current Canadian market by putting in such relevant information as location, size, and amenities. These provide a good starting point for sellers to determine how much they should sell their property.

Market Trends Analysis

It also shows market trends, comparable sales among other properties and provides so much more. By comparing their property with similar properties in the local area, sellers can learn more about market movements that would impact its pricing. Such important knowledge assists sellers when setting their prices correctly and situating their property competitively in the marketplace.

Informative Reports

Many online home value calculators generate detailed reports that outline various factors influencing the property’s worth. These reports might contain demographic information, trends in property appreciation, and information on recent sales in your area. These in-depth reports provide sellers with a deeper grasp of the factors that determine the value of their property and help them spot possibilities to maximize its worth. It will help them to think strategically and add more twist in the selling process.

Time and Cost Savings

Using online house value calculators can help sellers save time and money by avoiding expensive evaluations and consultations. Sellers can obtain a precise assessment of the value of their property with a few clicks, saving them the trouble of making appointments or waiting for answers. Sellers may concentrate their time and resources on other aspects of the selling process, such marketing and getting the property ready for sale.

In conclusion, Online Home Value Calculators are an important tool for sellers and property owners looking to determine their property’s value. It gives them clarity and a helping hand that gives them extra time by using this tool. It offers numerous benefits to sellers in this modernized generation where almost everything is digitalized.

If you need assistance or have any questions, don’t hesitate to reach out for a consultation. We’re here to help you every step of the way in your selling journey. Contact us now to get started!

Find a Local Real Estate Agent Experienced in Selling Multi-family Investment Properties

Selling multi-family investment properties demands a certain set of abilities and familiarity with the local real estate market. Working with a real estate agent who specializes in selling multi-family properties in the area can be beneficial for sellers and property owners who want to maximize their return on investment. This article will help you better understand the benefits of working with a real estate agent.

Real Estate Knowledge

A skilled local real estate agent offers priceless market expertise. They know the nuances of the local real estate market, which include latest developments, property assessments as well as buyer preferences especially related to multifamily properties. They have a deep understanding that enables them to decide when is the best time to market your property and ways that can make you on top among the other sellers in the real estate market. In addition, they may use their vast knowledge to highlight some unique features of your multifamily investment property, increasing its appeal to potential buyers.

Expert in Strategies for Targeted Marketing

Agents who deal with multi-family properties understand how to create targeted marketing strategies. They employ a combination of traditional and online methods to get potential buyers interested in your property, particularly investors looking for investment opportunities. These agents use different marketing techniques so that your property can be seen by many people, and this also helps in attracting potential prospects. These approaches can include professional photography and virtual tours to listing on popular real estate websites and social media platforms. That enhances your property’s visibility and attracts more qualified leads.

Transaction Management

There are several intricate procedures involved in selling a multi-family investment property, ranging from negotiations and inspections to paperwork and closing processes. An experienced multi-family property sales representative can handle these responsibilities with ease, relieving you as the seller of the burden and inconvenience. Due to their experience, transactions are managed smoothly, with fewer delays and any hazards that could endanger the selling process. To ensure a smooth selling procedure, they have also developed connections with various experts, like lawyers, inspectors, and appraisers.

Network of Investors

One of the benefits of hiring an agent who has dealt with multi-family properties before is that they know how to connect with other investors. Many times, these agents are usually acquainted with individuals and organizations that are actively seeking multi-family investments. For your property, your agent can bring in fast sales by using his connections to make desperate buyers aware of the value of multifamily properties.

Professional Negotiator

Negotiation is an important part of any real estate transaction, and having a professional on your side can really make a difference. A good number of people don’t understand what it means when they say “multi-family real estate agent,” but one key feature is the ability to negotiate skillfully. They engage in intense negotiations, ease buyer concerns, and get advantageous terms to make sure you receive the best deal for your property.

Therefore, many considerations make it reasonable for sellers to collaborate with a local real estate agent who has sold multifamily investment properties before. Their expert market knowledge, targeted marketing strategies, efficient transaction management, access to a network of investors, and professional negotiation skills all contribute to a successful sale. By choosing an agent with the right experience, you can maximize your return on investment, simplify the sales process and meet your property objectives with confidence. If you need personalized guidance, don’t hesitate to reach out and contact us for a consultation.

Book a Call
Get a Free ConsultationFind out what your home is really worth!
Scroll to top